Item grades, assigned for you
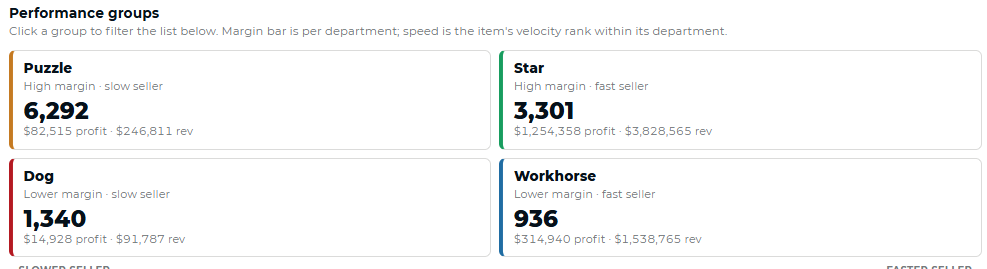
Every SKU lands in a performance group from live sales — with the margin and profit behind the grade right next to it. No spreadsheet, no manual tiering, no arguing about which items are the earners.

Product · Analytics
Four looks at the same live register data: a Dashboard that starts your morning, Sales Analysis that drills from chain to bottle, Catalog Health that shows where profit concentrates, and Item Analysis that grades every SKU.
No exports, no spreadsheet — the numbers come to you, already sorted by what matters.
Why reports weren’t enough
Every POS prints reports. You export, you sort, you squint — and the answer you actually wanted, what’s slipping and what it’s costing you, is still three pivot tables away. mPower starts where the report ends.
Sales, margin, to-dos and stock alerts from every store, current as of the last scan. The morning look that takes a minute — not a meeting.
Start at the whole operation, drill to the department, then the store that’s lagging, then the item dragging it. Chain to bottle in three clicks.
About one SKU in ten drives 80% of gross profit — and nearly half the catalog hasn’t sold in a year. Both stay in front of you: the earners to protect, the dead stock to stop reordering.
Stars, Workhorses, Puzzles, Dogs — graded automatically from live sales, never from a spreadsheet. The grade follows the item into every reorder, price review and promo.
Not reports. Answers.
Every view starts from the same live numbers and ends with something to do: reprice it, reorder it, move it, or leave it alone.
And underneath it all
Every view above draws from the same live register feed — so the four pillars, your compliance reports, and the question you type in plain English all agree with each other.
Every sale updates the picture as it happens — no overnight batch, no export, no “as of last Tuesday.”
“Top 20 items last month by gross profit” — type it the way you’d say it and get the answer in seconds, from live data.
The reports you rely on run themselves on your schedule — and land wherever you want them, without anyone remembering to run them.
All locations in one reconciled view — compare stores directly instead of pulling numbers from each and combining them by hand.
Pre-formatted for state requirements — including TABC and Pennsylvania distributor reporting — not a spreadsheet you reformat before each submission.
Inventory that stopped moving shows up on its own — with the cash it’s freezing — before it becomes a write-off you didn’t plan for.
On screen
Every SKU lands in a performance group from live sales — with the margin and profit behind the grade right next to it. No spreadsheet, no manual tiering, no arguing about which items are the earners.
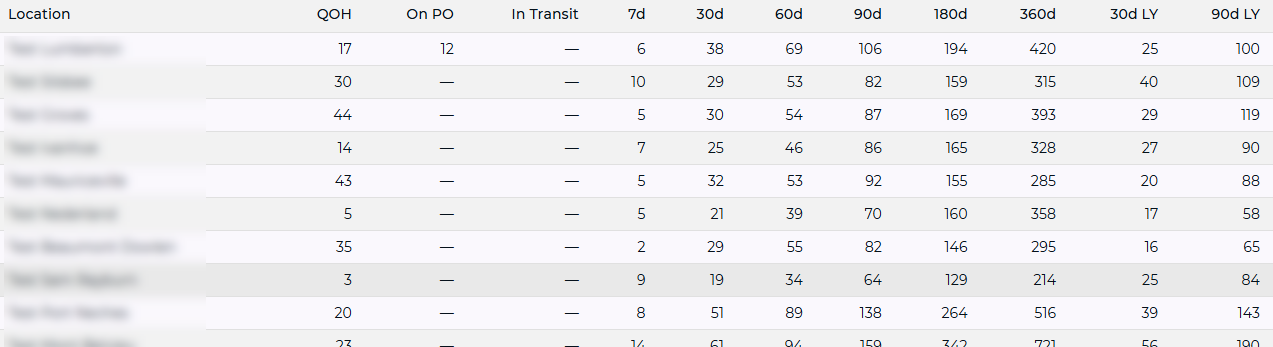
Compare locations directly in one reconciled view — the same item, the same period, the same definition of margin — instead of pulling a report from each store and squaring them up by hand.
From the register
Every sale at the counter updates the picture in real time. No export, no delay, no reconciliation — the register and the back office are looking at the same information, because they’re part of the same system.
That’s what makes the four pillars meaningful: they’re built from what’s actually selling in your store today. Not a template applied to your catalog from the outside.
The rest of the platform
Case breaks, deposits, age checks and deals, rung the way beverage retail works.
Explore→Stock tracked to the bottle, so you reorder before the shelf goes empty.
Explore→One purchase order for the group, a transfer check first, numbers that reconcile.
Explore→Solutions it powers: Liquor store profitability · Store operations · Liquor store compliance · Prevent stockouts
Works with: AI & Automation
Ready to stop exporting?
A consultative walkthrough of mPower’s analytics — with a real person who knows beverage retail.
Register-fed and real-time, with the dashboard, the drill-down and the item grades built in.
Schedule a Demo